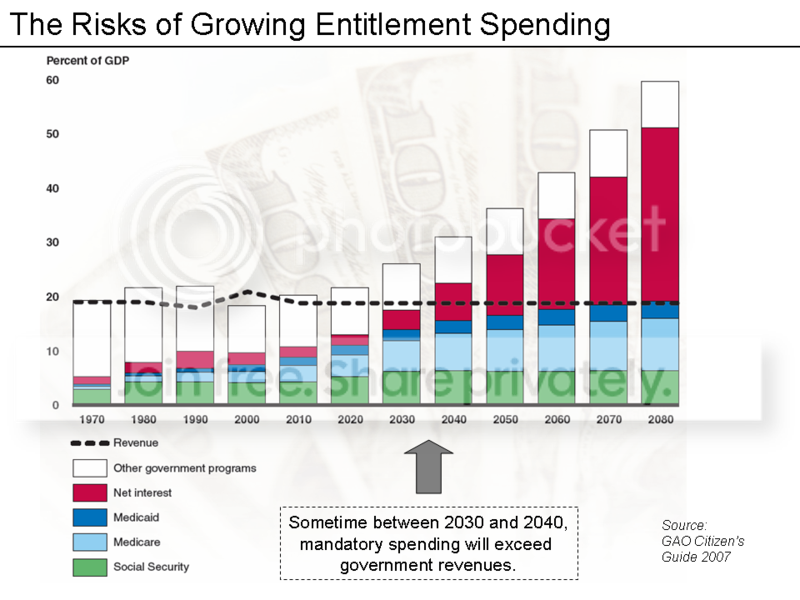
Target and Obamacare


n.b. Later editions of the GAO Citizens' Guide indicate somewhat lower estimates for entitlement spending as a portion of total revenue. See: Citizen's Guide 2011
Thank you for sharing that chart apparently from 2006 or 2007. I enjoyed browsing the guide its data came from.

When looking at the state of the current government budget, it's always important not to factor in anything that's happened over the past 7-8 years. Well done!
Quote

Originally posted by: Chilcoot
Thank you for sharing that chart apparently from 2006 or 2007. I enjoyed browsing the guide its data came from.

That's why DonDiego includes references, . . . for the edification of his readers.

Quote

Originally posted by: Chilcoot
When looking at the state of the current government budget, it's always important not to factor in anything that's happened over the past 7-8 years. Well done!

Chilcoot had requested a reference for hoops2's claim that Medicare/Medicaid/Social SecurityInterest payments would exceed total revenue; DonDiego provided one.
DonDiego had forgotten that The-President-Who-Provides-All-Things-Good is one of Chilcoot's favorites, and since 2007 things must've gotten oh-so-much better.

There is a similar Long-Term Budget examination provided every year, . . . including alternative scenarios. And there's lots of pages explaining many of the assumptions, . . . like assuming the Laws will be executed as written, usually, . . . except where history suggests they won't - like the inevitable annual delay in reduction of payments to physicians.
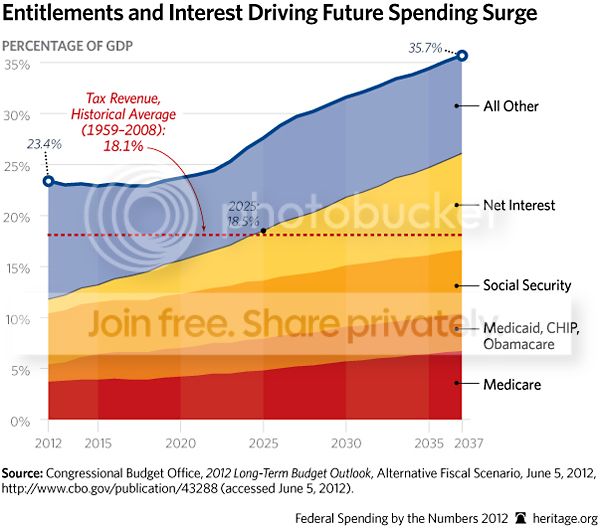
F'rinstance here's a more recent chart from the 2012 edition which Chilcoot won't like:


There is, however, one consistent thread:
". . . the projected growth in noninterest spending as a share of GDP over the long term stems from increases in mandatory spending, particularly in outlays for the government’s major health care programs: Medicare, Medicaid, the Children’s Health Insurance Program (CHIP), and the insurance subsidies that will be provided through the exchanges created under the Affordable Care Act (ACA).
. . . total outlays for those health care programs would grow much faster than GDP, increasing from 5.4 percent of GDP in 2012 to about 10 percent in 2037."
[boldface added - DD]

So, poor old DonDiego recognizes the limitations of such projections, but it's pr'bly better to have at least some idea of what's on the way. That way one can play around with the estimate to see to what factors the estimate is more sensitive. F'rinstance, DonDiego supposes a rise in the current historically-low interest rates would impact the budget significantly; historically-normal rates would bust the budget.

Don't Worry Be Happy
You've obviously forgotten the statement you're trying to defend. Here, I'll reprint it for you:
Quote

Originally posted by: hoops2
In the not to distant future Medicare, social security and interest will exceed all tax revenue
Where in there does it say "Medicaid"? Where does it say "CHIP"? Where does it say "Obamacare"?

HINT: It doesn't. But the chart you took from Jim DeMint's Heritage Foundation does. By the way, I know how important it has been to you in the past to always cite reputable, neutral sources, so congrats on posting that Heritage chart lol.

Also, the chart is based on assumptions that we now, 18 months later, know will not come to pass. Here's how CBO characterized the assumptions built into Heritage's chart:

The budget outlook is much bleaker under the extended alternative fiscal scenario, which maintains what some analysts might consider “current policies,” as opposed to current laws. Federal debt would grow rapidly from its already high level, exceeding 90 percent of GDP in 2022.

. . .

(A)lmost all expiring tax provisions are assumed to be extended through 2022 (with the exception of the current reduction in the payroll tax rate for Social Security)


Of course we know what became of the Bush Tax cuts 12 months ago.

Then, on the spending side, your chart also assumes more spending than will occur.

(The) scenario incorporates assumptions that through 2022, lawmakers will act to prevent Medicare’s payment rates for physicians from declining; that after 2022, lawmakers will not allow various restraints on the growth of Medicare costs and health insurance subsidies to exert their full effect; and that the automatic reductions in spending required by the Budget Control Act of 2011 will not occur (although the original caps on discretionary appropriations in that law are assumed to remain in place). Finally, under this scenario, federal spending as a percentage of GDP for activities other than Social Security, the major health care programs, and interest payments is assumed to return to its average level during the past two decades, rather than fall significantly below that level, as it does under the extended baseline scenario.

It's pretty easy to demostrate how you cherry-picked your chart. CBO ran two scenarios last year. The one that's coming to pass is the realistic, green one. You chose the bizarre orange one. I wonder why? (Not really, I know why.)


Washington Post

I appreciate you tried to pinch-hit for hoops2, never an easy task. Better luck next time.


Quote

Originally posted by: Chilcoot
CBO ran two scenarios last year. The one that's coming to pass is the realistic, green one. You chose the bizarre orange one. I wonder why? (Not really, I know why.)

DonDiego supposes it's too early to judge which scenario is more likely.
When in doubt DonDiego will assume the less prudent/more expensive scenario is more likely, . . . no matter which Party is in power. It's safer. (DonDiego can only assume that is what Chilcoot "knows".)

An aside:
DonDiego finds it most curious that forkushV knows why DonDiego fears President Obama and, now, Chilcoot knows why DonDiego chooses one of several scenarios offered by the CBO to predict Federal spending.
It's a puzzlement.

"It ain't the things we don't know that get us into trouble. It's the things we know that just ain't so."
__Josh Billings

Quote

Originally posted by: Chilcoot
It's pretty easy to demostrate how you cherry-picked your chart. CBO ran two scenarios last year. The one that's coming to pass is the realistic, green one. You chose the bizarre orange one. I wonder why? (Not really, I know why.)

What possible reason would the CBO have to publish unrealistic 'bizarre orange' scenarios? Do they do it just to screw with Don Diego...or do they really not have a clue what's going to happen that far in the future? Two contradictory projections in the same year.....I sure hope nothing important is being based on economic forecasts from this schizophrenic organization.

What's their historical prediction accuracy on multi-decade forecasts?


Quote

Originally posted by: alanleroy
Quote

Originally posted by: Chilcoot
It's pretty easy to demostrate how you cherry-picked your chart. CBO ran two scenarios last year. The one that's coming to pass is the realistic, green one. You chose the bizarre orange one. I wonder why? (Not really, I know why.)

What possible reason would the CBO have to publish unrealistic 'bizarre orange' scenarios?...
Um, because Congress requested that they do so.

Of course if Bush's disastrous tax cuts for the wealthy had continued, a worse case scenario would have been more likely. Not according to me, but according to the math, right?


Quote

Originally posted by: forkushV
Quote

Originally posted by: alanleroy
Quote

Originally posted by: Chilcoot
It's pretty easy to demostrate how you cherry-picked your chart. CBO ran two scenarios last year. The one that's coming to pass is the realistic, green one. You chose the bizarre orange one. I wonder why? (Not really, I know why.)

What possible reason would the CBO have to publish unrealistic 'bizarre orange' scenarios?...
Um, because Congress requested that they do so.

Of course if Bush's disastrous tax cuts for the wealthy had continued, a worse case scenario would have been more likely. Not according to me, but according to the math, right?


What's their historical prediction accuracy on multi-decade forecasts?
Already a LVA subscriber?
To continue reading, choose an option below:
Diamond Membership
$3 per month
Unlimited access to LVA website
Exclusive subscriber-only content
Limited Member Rewards Online
Join Now
or
Platinum Membership
$50 per year
Unlimited access to LVA website
Exclusive subscriber-only content
Exclusive Member Rewards Book
Join Now